Some of the different types of graphs and charts used
DOT PLOT-A dot plot is a type of graphic display used to compare frequency counts within categories or groups. As you might guess, a dot plot is made up of dots plotted on a graph.
PICTOGRAPH- Visual presentation of data using icons, pictures, symbols, etc., in place of or in addition to common graph elements (bars, lines, points).
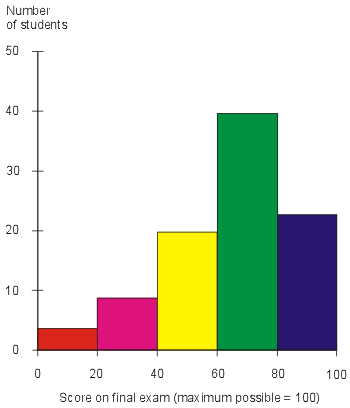
HISTOGRAM-A graphical display where the data is grouped into ranges (such as "40 to 49", "50 to 59", etc), and then plotted as bars.
Similar to a Bar Graph, but in a Histogram each bar is for a range of data and there are not spaces between the bars.
PIE CHART-a type of graph in which a circle is divided into sectors that each represent a proportion of the whole.
BAR GRAPH- a diagram in which the numerical values of variables are represented by the height or length of lines or rectangles of equal width.
www.nces.ed.gov/nceskids/Graphing/
This is an interactive Web site for students that allows them to create several types of graphs.


No comments:
Post a Comment